Keep Your 'Ion' the Prize
As many of our ITR speakers have discussed in recent blog posts, US Industrial Production is poised for growth in 2021.
Expect Supply Chain Pressures to Ease This Year – Here's Why
What would you do if you knew with a high degree of certainty that your supply chain issues were going to ease in the months ahead?
Due to unforecastable events – another economy-stopping COVID outbreak, for example, or a war that engulfs key shipping routes or sources of origin – there is no way to know with 100% certainty. But barring occurrences such as these, you can be confident that more goods will be flowing and that your inventory and order-fulfillment problems will be easing as we traverse 2022 and move into 2023. To be clear, the problems will not disappear overnight, but by inches at first, before the flow of goods begins to accelerate later this year.
First, it is only logical that there will be improvement in the supply chain, given our forecast for decelerating rise in the US and global economies as we traverse 2022. A more measured rate of growth in demand will be met with increased supply efforts from all participants in the supply chain as they seek to catch up with demand. This will be in their own best interest as demand pressures ease and competitive pressures remain. The improvement is going to be slow, but improvement is the logical outcome of today’s efforts and tomorrow’s anticipated change in the demand curve.
Second, there is a Global Supply Chain Pressure Index1 that relates very well to key leading indicators, one of which is the US Manufacturing Capacity Utilization Rate 1/12 rate-of-change – i.e., the difference, expressed as a percentage, between a given month of Utilization Rate data and the data for that same month one year earlier (see chart below).
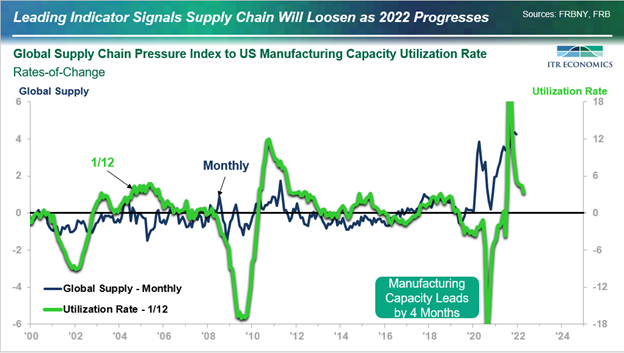
Given our forecast for decelerating rise in the US and global economies in 2022, it stands to reason that we will see the Global Supply Chain Pressure Index ease lower as we move through the coming quarters. The outlook is both logical and consistent with our use of key leading indicators, as illustrated above with the US Manufacturing Capacity Utilization Rate.
Armed with this outlook, now is a good time to determine which products you will begin to put back into production as materials/products/supplies start to return. It is also a good time to determine when you will begin easing up on your product allocations. The outlook also suggests that the cost increases of 2021 will likely come to an end in the first half of 2022, indicating probably one more opportunity this year to get price increases through to your customers. This is also the time to reassess your sales and marketing plans based on slower growth and increasing supply. Lastly, and perhaps most importantly, it is time to determine what these changes will mean to your cash flow in the coming year.
It is always good to have leading indicators light the economic path forward. You can accurately forecast your company’s revenue, orders, backlog, and other metrics using key leading indicators and our rate-of-change methodology. Please check out our website to learn more.
1Source: Gianluca Benigno, Julian di Giovanni, Jan J. J. Groen, and Adam I. Noble, “A New Barometer of Global Supply Chain Pressures” Federal Reserve Bank of New York Liberty Street Economics, January 4, 2022, https://libertystreeteconomics.newyorkfed.org/2022/01/a-new-barometer-of-global-supply-chain-pressures/.
Alan Beaulieu
President
As many of our ITR speakers have discussed in recent blog posts, US Industrial Production is poised for growth in 2021.
ITR Economics is proud to announce Joe Beaulieu’s promotion to Vice President of Technology.
CPI inflation did not increase in September. It declined, coming in at 8.2% – down from August’s 8.3%.