As economists, our conversations with colleagues, friends, and even total strangers often yield a plethora of interesting questions, from “Who owns the national debt?” to “What is GDP?”
Continuing in that theme, today’s blog post addresses another question: “Why use rates-of-change?”
A rate-of-change is the ratio comparing a data series during a specified time period to that series during the same period one year ago. These figures are expressed as an annual percent change and reveal whether activity levels are rising or falling compared to the prior year. ITR Economics’ three most commonly used rates-of-change are the 1/12, 3/12, and 12/12, which respectively represent the year-over-year percent change of a single month, a three-month moving total or average, and a 12-month moving total or average.
One fundamental feature of our economic analysis is the way we use leading indicators. We usually compute the leading indicators' rates-of-change rather than using their raw data directly. In this way, we uncover a more complete picture of the leading indicator evidence, which helps us to draw more useful conclusions regarding the timing and directionality of business cycle trends.
The US ISM PMI (Purchasing Managers Index) is one indicator we reference heavily. It is a diffusion index, meaning that a reading above 50 generally indicates that the manufacturing economy is expanding, while a reading below 50 indicates that it is contracting. We find that the PMI leads the US industrial economy by about one year, making it a useful leading indicator.
Chart: US Purchasing Managers Index vs US Industrial Production Index
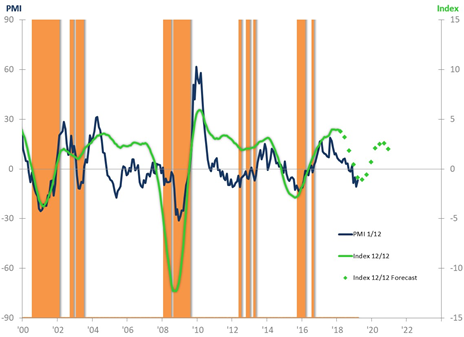
Sources: Federal Reserve Board, Institute for Supply Management, ITR Economics
On this chart, I graphed the US Industrial Production Index 12/12 rate-of-change in green. When the green line is below zero, it indicates a negative rate-of-change, and therefore general contraction in Industrial Production. I also shaded the time periods during which the PMI was below 50 in orange. In theory, the shaded areas should largely correspond to periods of contraction in Industrial Production.
There is some validity to this analysis, notably during the contraction in the early-2000s and during the Great Recession.
In other cases, however, the PMI indicator falsely predicts contraction, as in 2003 and again in 2012-2013, when the PMI dropped below 50 (orange shading) but Industrial Production did not contract. During the 2015-2016 contraction in the industrial economy, the PMI fell below 50 after Industrial Production had already begun to contract, eliminating any forward-looking usefulness of this analysis.
By adding the PMI 1/12 rate-of-change as the blue line on the chart, we gain a much more valuable leading indicator. As is visually evident, the PMI 1/12 provides a well-defined directional indication of movements in the Industrial Production Index 12/12. If we were to only look at the shaded areas, rather than the blue line, we would have a much less descriptive and nuanced view of the leading indicator relationship between the PMI and Industrial Production.
Converting raw data to rates-of-change allows us to examine trends – macroeconomic, sector-specific, or company-specific – in a new light. In this example, I used the 1/12 rate of change for the PMI and the 12/12 rate-of-change for the US Industrial Production Index. Determining which rate-of-change to use for any given analysis depends on many factors, including the volatility of the data and the leading indicator relationship.
If you are interested in discovering how rates-of-change and leading indicator analysis can assist in your business planning, please contact us. We would be happy to help!
Lauren Saidel-Baker, CFA
Economist