Indicators of Recession
Total Manufacturing in the US through the last 12 months is up only 1.1% from the same period one year earlier. Breaking it down to the last three months, manufacturing is 0.6% below the year-earlier period. Indications are that Manufacturing is going to slip from the current no-growth state into a recession in the second half of 2023.
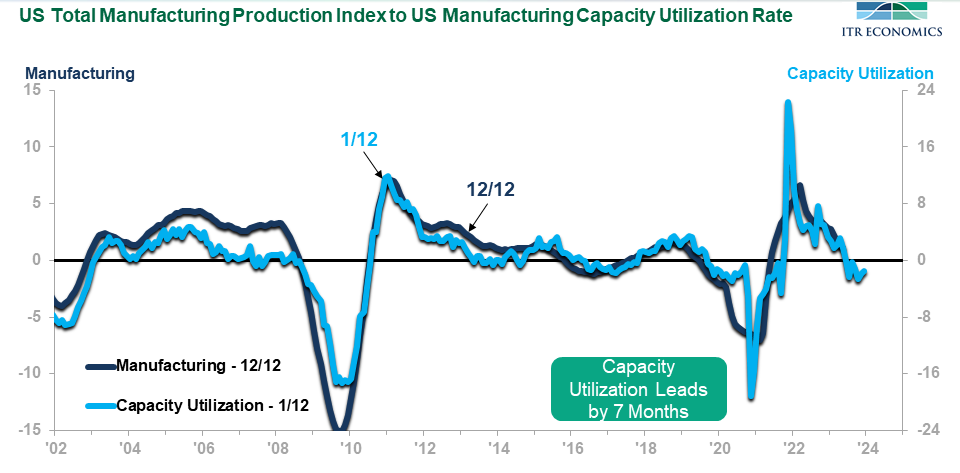
The Manufacturing Capacity Utilization Rate is a compelling leading indicator that supports our Manufacturing forecast. The chart below shows that Manufacturing Capacity Utilization is trending below year-earlier levels, as evidenced by the 1/12 rate-of-change (green line on the chart) moving below zero in December 2022. The Manufacturing trend (12/12 rate-of-change, blue line) is expected to follow suit. The recession will be noticeable, but it will not come close to 2008−2009 in severity.
The Utilization 1/12 rate-of-change leads Manufacturing by approximately seven months. Decline in the Utilization 1/12 through May 2023 tells us that the Manufacturing trend will be weakening through at least October 2023. Expect the current no-growth status to deteriorate into recession in that period.

Interest Rates Went Too High
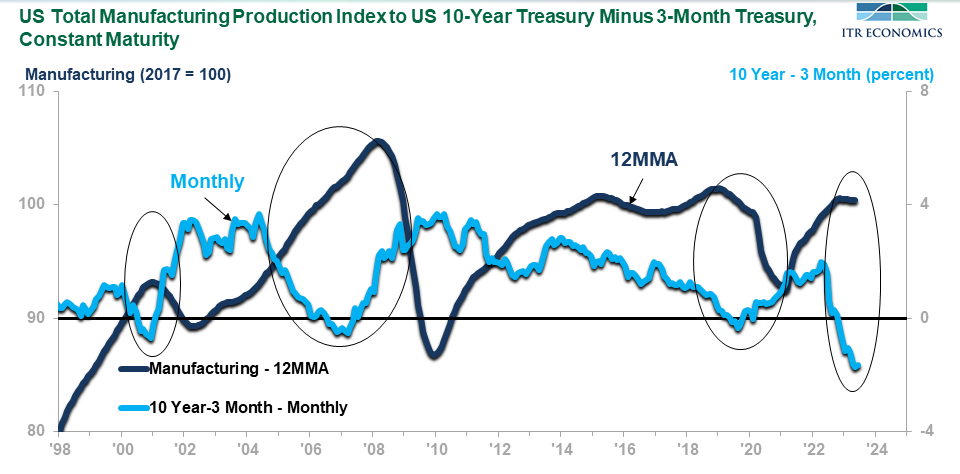
The chart below depicts how the Manufacturing 12MMA data trend responds to an inverse yield curve. The inverse yield curve comes about when the three-month Treasury yield (driven by the Fed funds rate) rises above the 10-year Treasury yield. The current negative status is a direct result of how rapidly and how high interest rates were pushed upward once the Fed decided to quell inflation. Three prior inverse yield curves are shown. Each one is circled.
Each of the three prior inverse yield curve situations was followed by a recession in Manufacturing. Note that Manufacturing was slipping downward (like the current circumstance) before the COVID-induced recession hit. Based on the leading indicators and the negative yield curve, a recession in Manufacturing is inevitable.
Also note on the chart that following each of the last three inverse yield curves, recovery in Manufacturing begins only after the yield curve normalizes. Normalization is depicted by the green line on the chart going above zero. This is a reason why it is so critical for manufacturers to see the Federal Reserve start to lower interest rates. Simply no longer pushing them higher will not suffice. Failure to return to a normal yield curve in the next nine months could delay the onset of the projected recovery. The recovery ties in with the US Total Industrial Production forecast provided to ITR Economics members.

The Global Economy is Not Helping
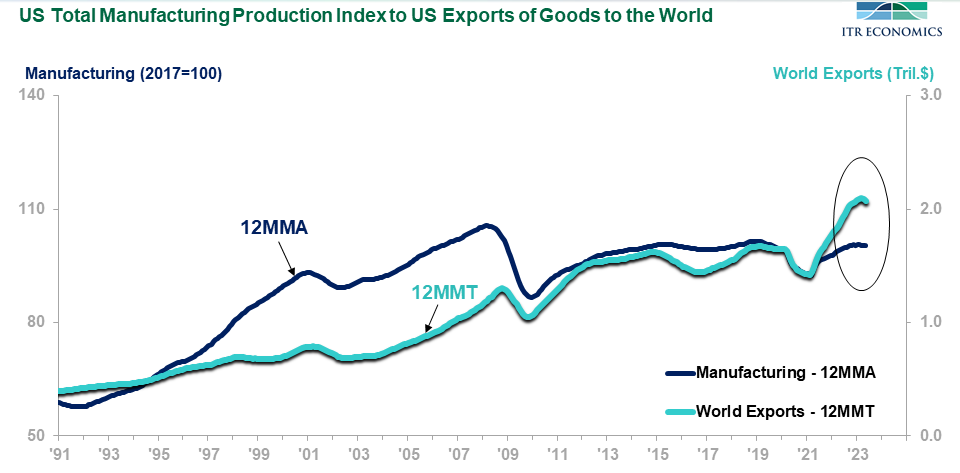
The export of goods from the US to the rest of the world peaked in March 2023 (12MMT data trend). The onset of decline is consistent with our forecast of general weakening in the global GDP and Industrial Production trends. Further decline in exports is probable.
The chart shows that the US Manufacturing 12MMA data trend will experience the ill effects of weakening exports. ITR Economics is projecting that a weakening global economy will persist through 2024. Our manufacturing base is globally linked. We should expect downside pressure on US Manufacturing through the next six quarters.

Conclusion
US Manufacturing is facing cyclical forces that will result in a recession for manufacturing in general.
Compare your company’s (or market’s) 12MMT data trend to the US Manufacturing trend. Doing so will tell you if a) you are also heading for a recession unless you do something different, or b) you will slow in your growth rate but likely will not break downward into recession, or c) you are in a segment of the economy that will allow you to safely ignore the recession talk.
ITR Economics can assist you in seeing the future more clearly through a variety of programs.
Watch ITR Economics’ Fed Watch on Fridays. These three-to-five-minute YouTube videos will keep you informed about interest rates with the necessary insight and frequency.