Early in the COVID-19 pandemic, decline was nearly universal in economic metrics across most sectors, including nonresidential construction markets. While most economic metrics and leading indicators we track bottomed out during the second quarter and bounced back in the third and early days of the fourth, nonresidential construction metrics have largely continued to point downward – until recently. Last month we received the most encouraging data point to date for nonresidential construction: a pleasant increase in the US Architecture Inquiries Index.
The Architecture Inquiries Index, one of several diffusion Indexes published by the American Institute of Architects (AIA), rose to 51.6 in August. That raw number is a result of a survey in which participants are asked whether project inquiries increased, decreased, or stayed the same in the month that just ended.
The raw 51.6 value may not mean much to you readers on the surface, but it is above an important threshold: 50. Scores above 50 indicate an increase in demand and billing, or, for this particular index, an increase in inbound inquires to architects across the US in August relative to July. This is the first monthly score above 50 since the metric cratered in March. While this is good news, we must remember that, so far, it is just one month of data. It is also important to note that it is the only component from the AIA that has risen above 50 as of yet:
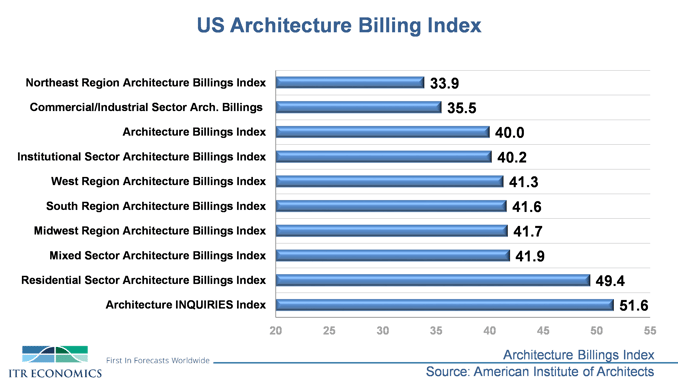
As you can see, all other sector- and regional-based components remain underwater relative to the 50-line. It makes sense that the Inquiries component rebounded the fastest, as an increase in inquiries will naturally precede an increase in actual services delivered and billed by architects across the US. The above metrics that are still below 50 are indicating fewer new nonresidential construction projects moving forward in 2021 and support our forecast for recession in US Nonresidential Construction during 2021.
While we acknowledge the issues that will plague the industry in the near to medium term, the Inquiries reading above 50 can still be taken as an early green shoot preceding the eventual climb-back for the US nonresidential construction industry starting by late 2021 and heading into 2022
If your business is dependent on nonresidential development as a demand driver, directly or indirectly, it would behoove you to evaluate your business's rates-of-change against one or several of the leading indicators in the dashboard above. The uptick in the Inquiries Index very likely means an increase in your business many months into the future, not immediately. In order to truly optimize your planning and decision-making, you will want to know more precisely when the uptick will materialize for you, and how many months of malaise in the market you will have to sustain between now and then. Our DataCast platform is a great way to do exactly that.
The data is telling us things are likely to get worse in the nonresidential side of the economy before they get better, but at the same time the data is finally giving us some firmer signaling of when the "better" is going to show up. Your challenge is to manage the decline and make sure you are in a position to succeed when the growth trend comes.
Connor Lokar
Economist