News
A Look at Higher US Inflation Resulting From the Ukraine War
Prior to the war in Ukraine, disinflation in the US was widely indicated by the leading indicators.
Any one indicator can provide a false signal, but a proven group of indicators dramatically reduces that probability.
At least half of investors check in on their investments at least once a day. Some of you, I would guess, are saying, "Just once?” It is an easy habit to get into and it is encouraged by the media, as every day there is movement in the stock market, and there is seemingly always a reason for why stocks moved the way they did that day. “Seemingly” is the operative word in that sentence.
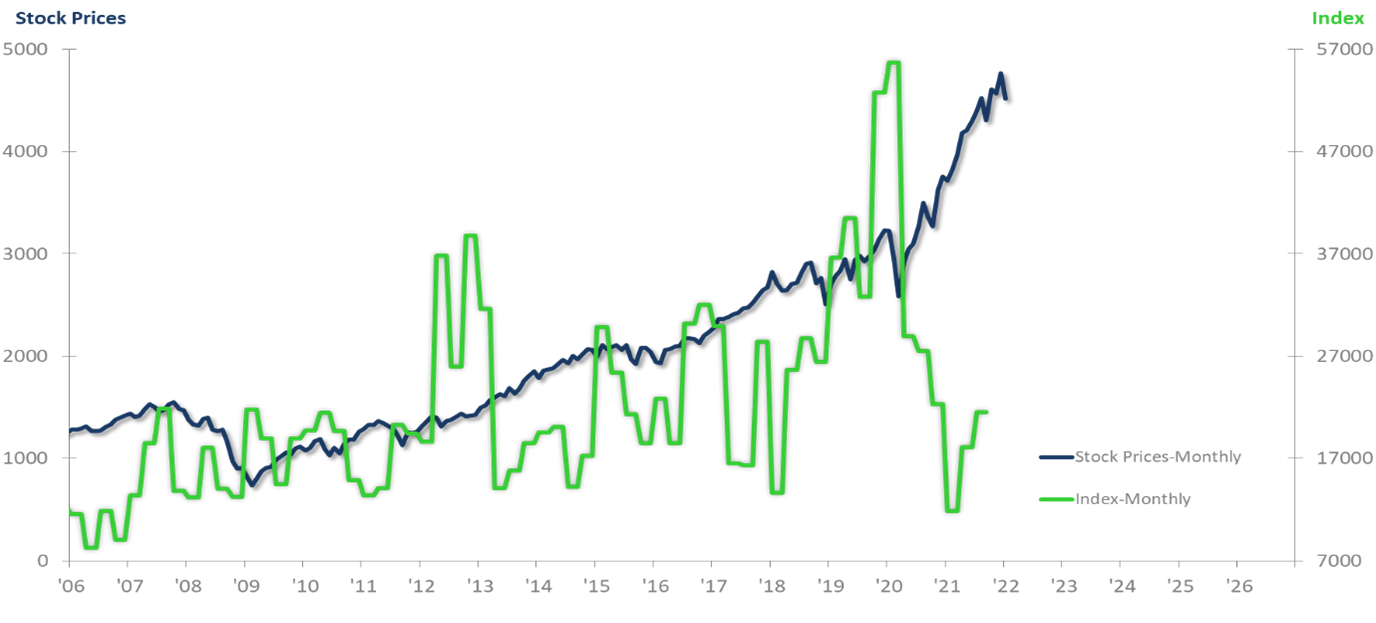
There is seemingly no end of global occurrences that can be the cause of a momentary movement in the S&P 500, and no doubt many are real, but they are also usually short term. The endless causes for worry create uncertainty in the world as well as in individuals. The World Uncertainty Index is the green line below, charted on a monthly basis. It is very volatile and does not provide any valid indication of what happened in the stock market that day.
US S&P 500 Stock Prices Index to World Uncertainty Index
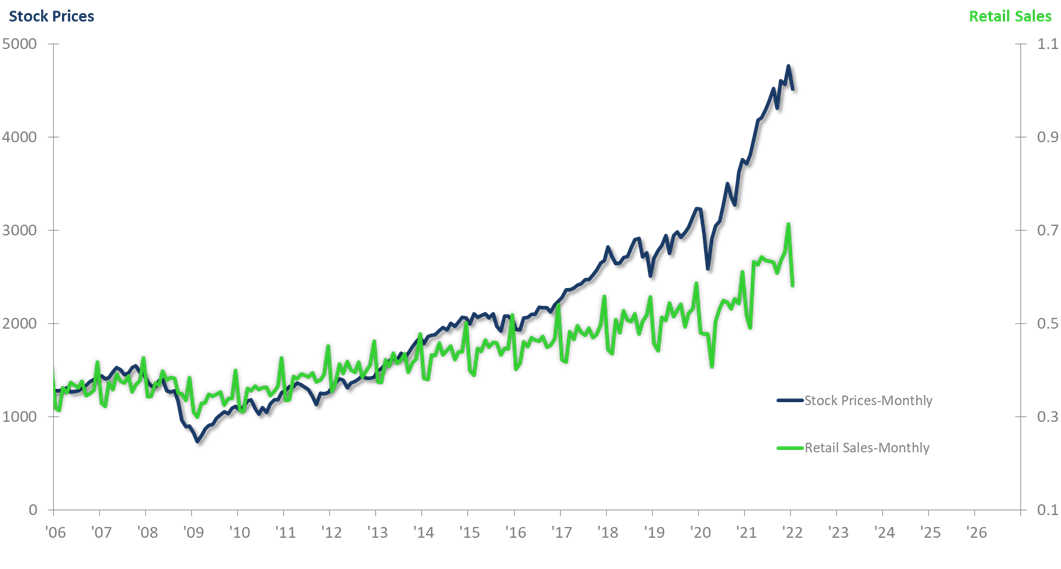
World Uncertainty relies on perceptions. Perhaps hard numbers provide a better clue as to what will be happening in the S&P 500 through the near term. The green line below shows the monthly trend for US Total Retail Sales. The Retail Sales metric is a popularly reported number subject to all kinds of interpretations, and many use it to hypothesize why the stock market moved up or down that day. Please look at the chart below, as it illustrates that it is impossible to see the future trend of the S&P 500 from a one-month movement in Retail Sales.
US S&P 500 Stock Prices Index to US Total Retail Sales
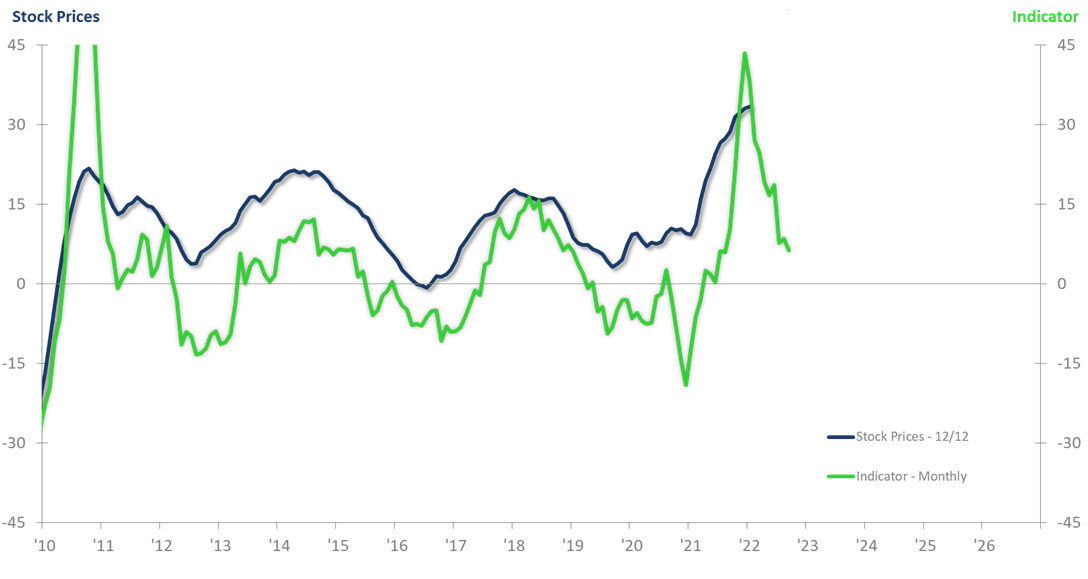
Lifting our sights above the daily input and switching to a rate-of-change methodology that uses leading indicators can show you the business cycle pressure on the S&P 500, and it can do so with an eight-month lead time. Our ITR Financial Leading Indicator™ is one of the tools we use to project when cyclical changes will occur in the stock market. We use other indicators in concert with the ITR Financial Leading Indicator, because any one indicator can provide a false signal, but a proven group of indicators dramatically reduces that probability. Using proven groups of leading indicators is part of our process and has been a key part of the success of the ITR Equity Optimizer. I use the Optimizer, and I am extremely pleased with the results, as are many others. Please visit itroptimizer.com if you want to know more.
US S&P 500 Stock Prices Index to ITR Financial Leading Indicator
The bottom line is that constantly watching common metrics is not going to help you know when to switch your positions in the market (buy/sell, defensive/cyclical, sector preferences). Worse yet, watching the first two metrics mentioned above may result in a reduction in your investment portfolio or at the very least a loss of sleep.
Prior to the war in Ukraine, disinflation in the US was widely indicated by the leading indicators.
This webinar will cover the state of US construction, how different industry segments are faring, and which regions the leading indicators are...
Few are aware of leading indicator inputs. Even fewer are aware of how to conduct timing analyses using the leading indicator inputs.