Supply chains are still struggling to catch up with demand coming out of pandemic, and that could not be more apparent for the automotive industry. Shortages of inputs, such as semiconductor chips and related devices, have led auto manufacturers to slow production and left dealer lots barren, driving up the prices of both new and used cars. The US Consumer Price Index for New Cars has risen 3.1% during the last 12 months . While this may seem unremarkable at face value, it is significant given that New Car Prices have been virtually flat since 2012. The US Consumer Price Index for Used Cars and Trucks is up a staggering 29.7% over the last 12 months.
What does the data tell us?
US consumers have purchased 16.147 million light vehicles in the 12 months through May, 0.709 million units below the pre-pandemic level. By comparison, North American auto manufacturers have only produced 14.591 million units during this timeframe, 1.592 million units below the pre-pandemic level. While US consumers purchase vehicles produced outside of North America and North American producers sell outside the US, the data are nonetheless illustrative of the startling gap between supply and demand. That gap has resulted in the inventory available at dealer lots only being enough to cover a record-low 28 days worth of sales. In contrast, in the five years prior to the pandemic, dealers had between 55 and 92 days worth of inventory sitting on their lots.
New and used car dealers have been able to command higher prices given the lack of inventory available for purchase. However, volume has been constrained, harming producers and consumers alike. For example, Ford’s June sales of F-Series pickup trucks were down nearly 30% from the previous June as consumers struggled to find trucks to purchase.
What’s the outlook for the Automotive Industry?
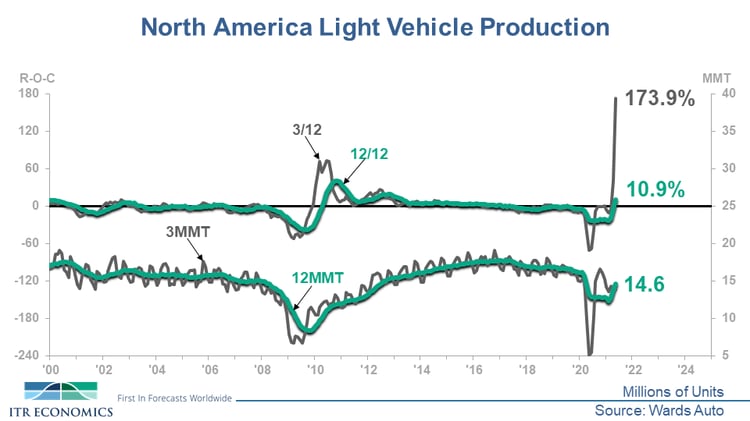
North America Light Vehicle Production has tentatively entered Phase B, Accelerating Growth, of the business cycle. Pictured below you will notice that 12/12 – the most recent 12 months of Production relative to the prior 12 months, expressed as a percentage – is at 10.9%.

The 3/12 – the most recent three months of Production relative to those same three months one year earlier, expressed as a percentage – is at an impressive 173.9%. This is a positive ITR Checking Point™ that suggests more upside business cycle momentum in the coming quarters. However, it is important to note that the 12-month moving total (the bottom line on the chart) is at 14.591 million units, which is well below the pre-pandemic level, to say nothing of the 2017 record high of 17.806 million units.
In North America we clearly have not “fully recovered” from the losses due to the pandemic. Based on the continued issues with chip shortages, it is unlikely that we will get back to 2019 levels during the second half of this year. Please see our ITR Trends Report™ each month for the three-year forecast for North America Light Vehicle Production and what it means for your business.
Taylor St. Germain
Analyst and Speaker