Solutions
Examining Trends in the US Energy Industry
Tune in to this Business Series Webinar with ITR Senior Forecaster Connor Lokar as he reviews the data behind the latest trends in the US energy...
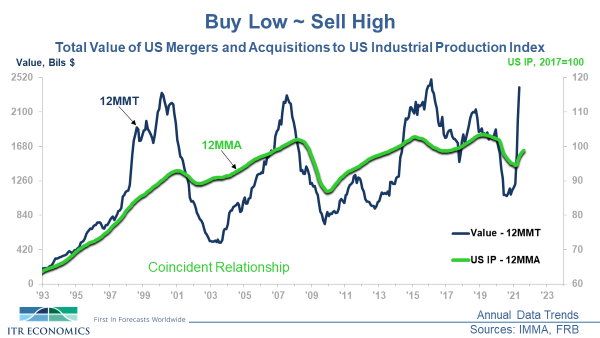
Buy low and sell high. However, the “sell” side of the equation is normally harder to discern.
Buy low and sell high. Sounds easy. Buying at the low is not as difficult if you know what “low” you are looking for. A low in the economy’s business cycle? In a particular market? An overall industry? Or a specific company that has fallen on hard times? ITR Economics can clearly help you know when the above conditions will be applicable. However, the “sell” side of the equation is normally harder to discern. There are also non-economic factors such as age, health, and burn-out. But maybe you would be willing to stay the course a little longer to cash out for higher stakes.
It may be that discerning a forthcoming high is made more difficult on one extreme by innate optimism and by echoes of the “boy who cried wolf” on the other. Getting out too late or too early means leaving money on the table. Money you have worked too hard to build. It is not that perfectly timing the market is probable. However, by using objective, non-emotional analysis in the equation you can know if you are selling near the top, have the luxury of waiting for a sweeter offer, or should be “taking the money and running.” The chart below shows that valuations, in general, reach an apex slightly before a business cycle high occurs in the macroeconomy.
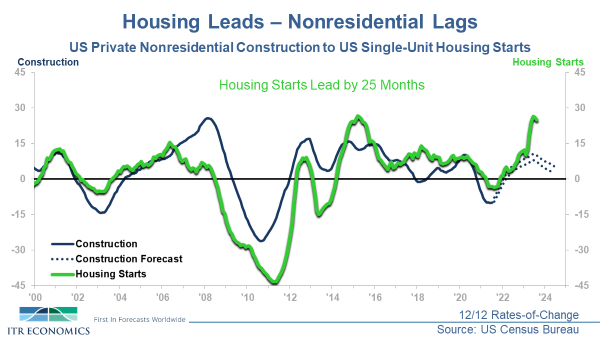
The above applies if you are seeking to sell a company that generally moves coincident with US Total Industrial Production and GDP. The “generally coincident” condition is the norm. However, there are companies and markets that lead the general economy, and others that lag. How this works for industries/markets is illustrated by the Housing to Nonresidential Construction chart below (using 12/12 rates-of-change). Companies in these industries will tend to move as either leading or lagging parts of the wider economy.
Housing typically leads Nonresidential Construction by 25 months, with coincident indicators like Total Industrial Production falling between the two. (Housing is shifted by 25 months in the chart below to show the relationship.) ITR has leading indicators for the various markets, whether the markets lead or lag the general economy. We have also developed a leading indicator specifically applicable to M&A valuations.
Thinking beyond the timing of the sale, there are additional factors affecting the wealth derived from the sell transaction.
1. Will there be sufficient growth in the company’s EBITDA to more than compensate for a potential capital gains tax hike?
2. When will inflation and higher interest rates start to take their toll and compress EBITDA multiples?
3. The stock market going into a funk depresses M&A activity, and you should avoid trying to sell in that environment. That is where our objective analysis combined with the ITR Equity Optimizer™ can provide valuable insight.
4. Does the firm you want to sell perform best when higher interest rates and lower stock prices are present? If so, then those are circumstances to look for rather than avoid.
5. Avoid work-out arrangements when the industry/market is nearing a cyclical decline.
The thoughts above are examples of how our ability to objectively analyze and forecast the trends impacting the selling price of your business can reap significant rewards for you, the seller.
Join us for our October 22 ButcherJoseph & Co. webinar, cohosted by ITR Economics. We are joining our expertise with ButcherJoseph's to provide additional insight and answer your questions.
Tune in to this Business Series Webinar with ITR Senior Forecaster Connor Lokar as he reviews the data behind the latest trends in the US energy...
Inflation is likely to rise due to several factors. How can business leaders address these pressures to maintain economic stability?
The labor shortage pain point seems to be a nearly universal concern for business leaders across industries and regions.