What Is Up
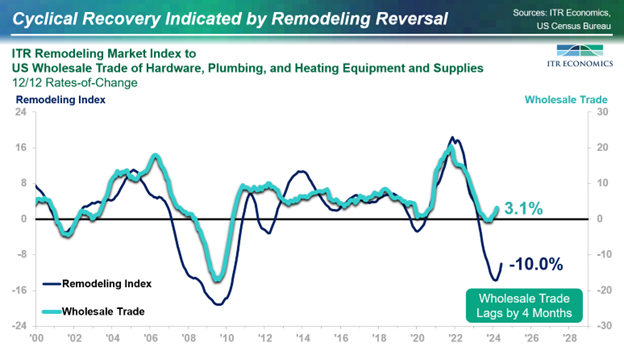
While the Single-Family Permits trend is showing recent signs of weakness, the ITR Remodeling Market Index™ is in the early stages of a new rising trend. This offers a bright spot for aspects of the construction industry, as indicated by the chart below.
The chart depicts the 12/12 rate-of-change for Wholesale Trade of Hardware, Plumbing, and Heating Equipment and Supplies. The 12/12 shows that the level of Wholesale Trade slipped below the year-ago level of activity a couple of months ago. The latest data shows activity for the last 12 months is now up 3.1% from one year ago. The reversal from decline to rise is consistent with the onset of rise in the ITR ITR Remodeling Market Index. Wholesalers in this space should expect to see additional marginal improvement compared to a year ago.

What Is Down
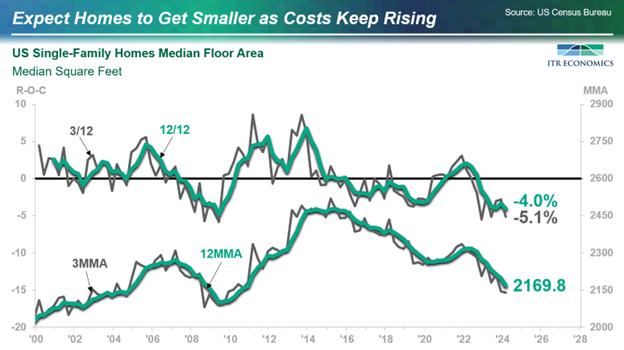
Homes are getting smaller, and the trend is likely to continue based on the rates-of-change on the upper portion of the Median Floor Area chart. The 3/12 and 12/12 are signaling that the data trend on the lower portion of the chart will continue to head lower.
The trend is logical and consistent with our expectations. One way to compensate for high building costs per square foot and higher mortgage rates is to get a smaller house.
The downward trend has implications for home construction participants. Smaller houses mean not only a small slab/foundation and fewer studs, but also that the three-bathroom home of yesterday may turn into only a two- or perhaps two-and-a-half-bathroom home. Less countertop material, flooring, and HVAC equipment, as well as smaller roofs.
Developing a brand around climate damage repair, or remodeling, or condominiums can offset some of the loss stemming from size. Gaining market share in your current market, while maintaining margins, is also a possible way to counter the trend, albeit one that must be carefully managed.

What Cannot Be Quickly Fixed
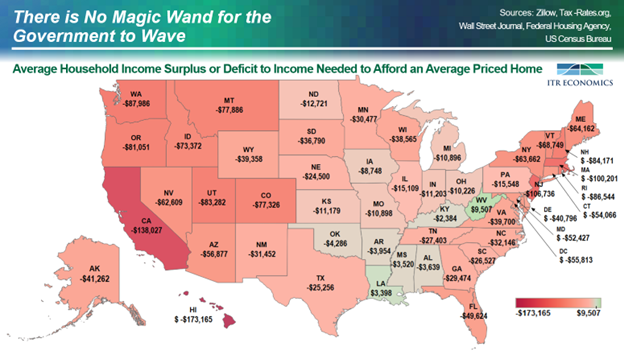
Housing affordability is an ongoing issue and one that will not be quickly solved. The chart below reveals that the “unaffordability” of housing varies from one state to the next. That means a national “one size fits all” solution is destined to create unintended consequences.
The chart below was created by ITR Economics. We compare the average household income by state needed to purchase the average-price home in each state. The numbers on the chart show how “short” the average household is, or how much surplus the average household has (thereby making the average home relatively affordable).
The issues behind these imbalances are complex, ranging from local restrictions to local costs to local incomes to local demographic changes, to name a few. It is our contention that the marketplace is best equipped to solve the conundrum of affordability. Others may think direct government intervention is required. If you are in the latter camp, please know that the political process will take years, and the unintended consequences will likely give rise to further government intervention.
