News
What the July Jobs Report Really Tells Us
Does the July jobs report justify the alarming headlines in the media? Discover what the data really tells us about the state of the labor market.
The media's latest headlines and soundbites about inflation seem a bit alarming. Is there cause for concern? Find out in a blog from ITR Economics.
The headline demanded attention: “Inflation Coming In Hot” with a follow-on sentence about the “largest monthly increase since January” (bold in the original). All in all, the article is enough to make the casual reader wonder whether disinflation (a waning rate of inflation) will continue or whether inflation is making a comeback, with the possible ensuing result being an increasingly aggressive Federal Reserve Board.
Our analysis shows that disinflation will be the general trend through late 2024 and potentially into 2025. Expect today’s annual rate of inflation of 5.4% to descend to approximately 1.6% by year-end 2024.
Our outlook and analysis of the Fed has not changed. Please see Fed Watch by our CEO and Chief Economist, Brian Beaulieu, for more information.
The “largest monthly increase since January” is certainly an attention-getting statement, and it may be true depending on which data series you are using. We use the CPI for all urban customers in the US, which is sourced from the Bureau of Labor Statistics. Urban areas account for 80% of the population. Our preferred measure of inflation shows:
Some temporary upward movement in the inflation rate is to be expected when we are in the middle of a long period of disinflation. We have seen it occur many times before. Our analysis indicates that we may see other temporary interruptions while we experience a longer-term declining trend. Here are a few of the reasons why that is our outlook:
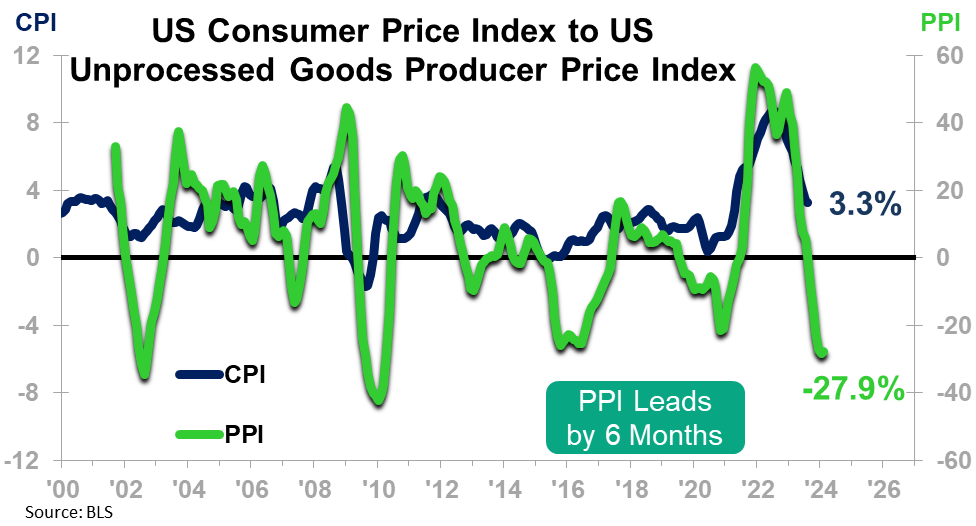
1. US Unprocessed Intermediate Goods Producer Price IndexThe green line on the chart below is the US Unprocessed Intermediate Goods Producer Price Index 3/12. It leads the CPI 3/12 by six months, indicating that disinflation will be with us into 2024 and that we are not likely on the cusp of another round of sustained inflation.
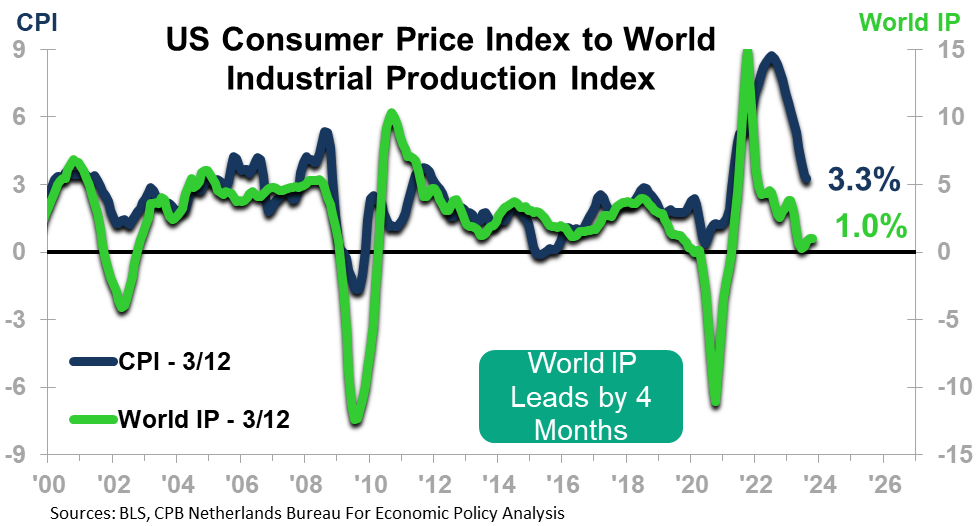
2. World Industrial Production
The global economy is cooling off, as indicated by the World Industrial Production 3/12 trend (green line) on the chart below and by the recession in Europe Industrial Production (not shown). The cooling global environment eases the demand for goods and services, which leads to disinflation. The current trend and our outlook for World Industrial Production portend disinflation into 2024.
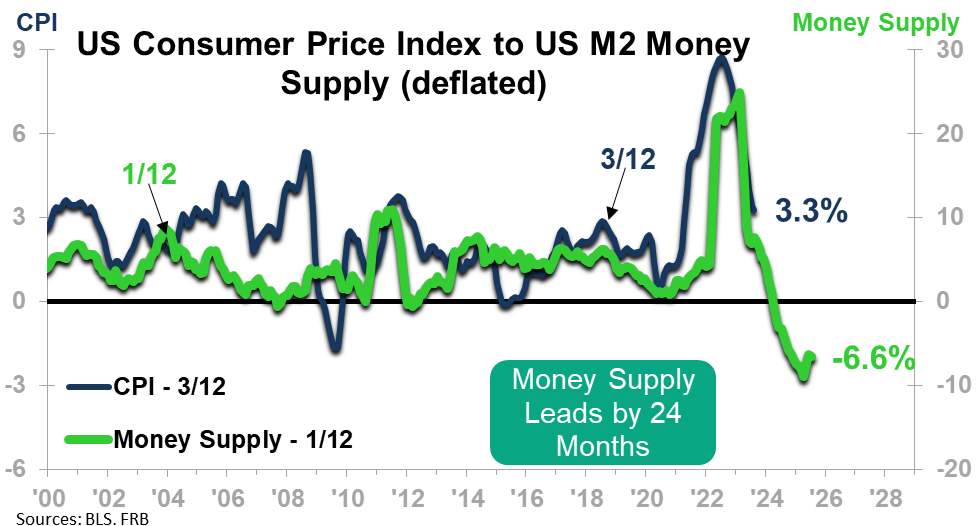
3. The Money Supply
The chart below shows the M2 measure of the Money Supply 1/12 rate-of-change compared to the CPI 3/12 rate-of-change. The relationship is not perfect, but it does provide a good view into what to expect for inflationary pressures. The Money Supply 1/12 (green line) is signaling disinflation through 2024.
Ongoing disinflation means an easing in the rate of rise in prices in many parts of the economy. Some purchasers of raw materials may experience actual deflation (reduction in costs). However, it is best to remember that commodity prices may be coming down, but labor costs and other costs are not. Give your sales team some intel so they know how to counter customers who are expecting (or pushing for) price cuts. The further away you get from the raw material, the more labor, electricity, and other inputs impact your costs and profitability.
ITR Economics provides forecasts for a host of commodities and other producer price indices so you can know what to expect in terms of your cost inputs over the coming year. Reach out to us at itr@itreconomics.com if you would like to make your plans with a solid, dependable view of the future.
Does the July jobs report justify the alarming headlines in the media? Discover what the data really tells us about the state of the labor market.
The federal government has collected more revenue so far this fiscal year than last, but federal spending has also increased, and by a greater amount.
The June CPI result reflected a 9.1% year-over-year rate of inflation. It was the highest rate experienced in the US since Nov 1981.