It’s 2021 – Do You Know Where Your Supply Chain Is?
Now that the dust has settled, let this experience serve as a reminder of the importance of understanding and improving your own supplier relations.
If your sales trends exhibit seasonality, following your rate-of-change analysis is vitally important and will reveal where you are in the business cycle.
Article originally posted July 2019.
As we enter the doldrums of summer, it is the perfect time for business leaders to consider their seasonal selling trends.
Perhaps you are busiest in winter, like the US retail sector, which typically enjoys a strong holiday selling season. For such firms, thoughts of sun and sand portend a seasonal lull in activity and perhaps more out-of-office time.
Or, your firm may be closing in on the peak of its seasonal activity, as in the construction industry. New construction projects tend to avoid breaking ground in the winter, when the ground – at least in colder climates – may be frozen.
At ITR Economics, we are often asked whether our rate-of-change methodology, described in detail in this previous post, applies to companies that exhibit strong seasonal trends. The good news is that this analysis is as useful for data with seasonal variations as it is for data without these patterns.
Consider the following chart, which shows US Single-Unit Housing Starts as an example of a seasonal economic indicator. The Housing Starts three-month moving total (3MMT) is graphed in grey on the bottom. This quarterly rolling total exhibits strong seasonal trends; the total rises and falls regularly each year.
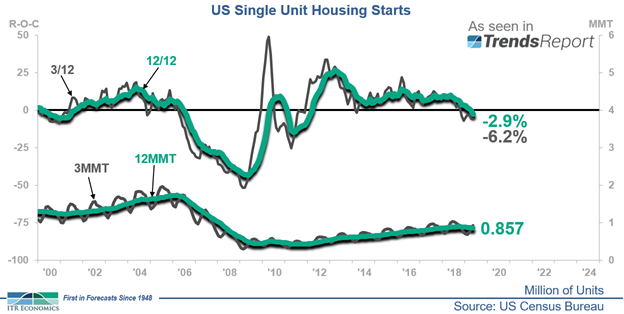
Yet the 3/12 rate-of-change, represented by the grey line above, does not show the same seasonal pattern. Why? The Housing Starts 3/12 shows the difference between the 3MMT and the 3MMT from the same period one year earlier. Therefore, each busy season is compared to the busy season of the prior year, while the slow seasons are compared to earlier slow seasons.
On an annual basis, seasonality is not a concern. The 12-month moving total (12MMT) by definition includes every month of the year, busy and slow seasons alike. For a similar reason, the 12/12 is also immune to seasonal variations. These trends are visually evident in the teal lines on the chart.
If your sales trends exhibit seasonality, following your rate-of-change analysis is vitally important and will reveal where your business is within the business cycle, and where you are likely to be in a few months. If we can help you with this analysis and a longer-term outlook, please contact us!
Lauren Saidel-Baker
Economist
Now that the dust has settled, let this experience serve as a reminder of the importance of understanding and improving your own supplier relations.
The ITR Economics team hopes that one of your New Year's resolutions is to be a data-driven decision maker in 2021.
We wanted to address common questions we are hearing from clients about recession risk and forecast changes in this ever-changing tariff environment.