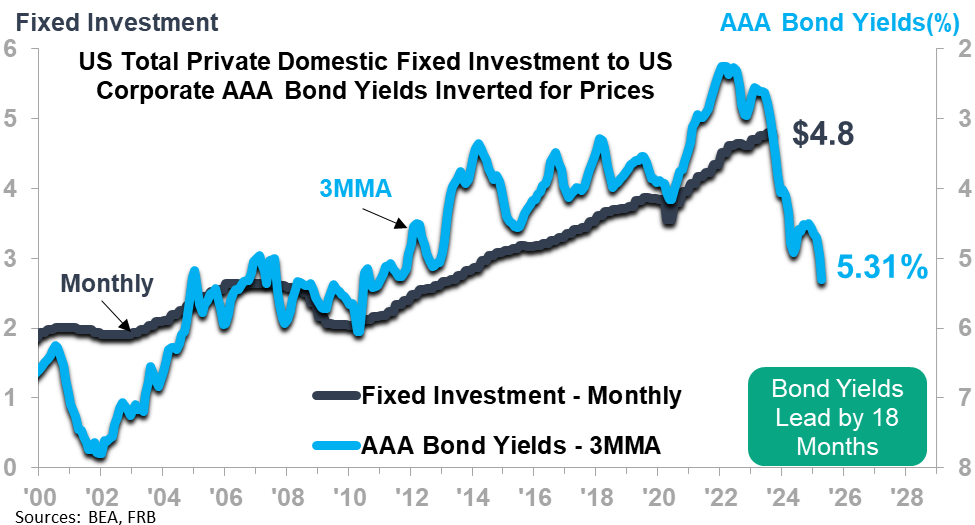
US Total Private Domestic Fixed Investment1 is at a record high $4.794 trillion and 3.3% higher than the year-ago level. Private Fixed Investment consists of purchases of residential and nonresidential structures, equipment, and intellectual property products by private businesses in the US. It comprises 17.4% of GDP, and its growth or decline has an impact on the overall economy. Total Private Domestic Fixed Investment will soon be in a declining trend that will likely extend into early 2025. Higher interest rates (the first chart below) and the tightening of the money supply (M2, deflated, shown on the second chart below) warn of the upcoming decline in private investments.
.png?width=975&height=525&name=US%20Total%20Private%20Domestic%20Fixed%20Investment%20to%20US%20M2%20Money%20Supply%20(deflated).png)
Nonresidential Fixed Investment is at a record high $3.718 trillion. It is 77.7% of Total Private Fixed Investment. The three major segments to Nonresidential Fixed Investment – structures, equipment, and intellectual property – will have their own timing and dynamics in the year ahead.
Nonresidential Structures
US Private Nonresidential Construction2 is at a record high $641.1 billion and rising. The 12/12 is at its highest in 15 years, at 19.5%. External leading indicators, such as the Single-Family Housing Starts 12/12, suggest that the Nonresidential Construction 12/12 will soon be reaching a high, with an attendant slowing in the 12MMT rate of rise. ITR Economics is forecasting a third-quarter-2024 12MMT high, with subsequent decline extending through 2025.
Equipment
Machinery New Orders are not inclusive of all equipment, but the dataset provides a good view of this segment of fixed investments. Machinery New Orders are a thin 1.1% above the year-ago level (12/12), and the 12MMT stands at $449.4 billion and has stopped rising. A declining trend is imminent, putting this area of fixed investments ahead of nonresidential structures’ decline and more in line with US Industrial Production. Expect the declining trend in Machinery New Orders to last until late 2024/early 2025.
Intellectual Property
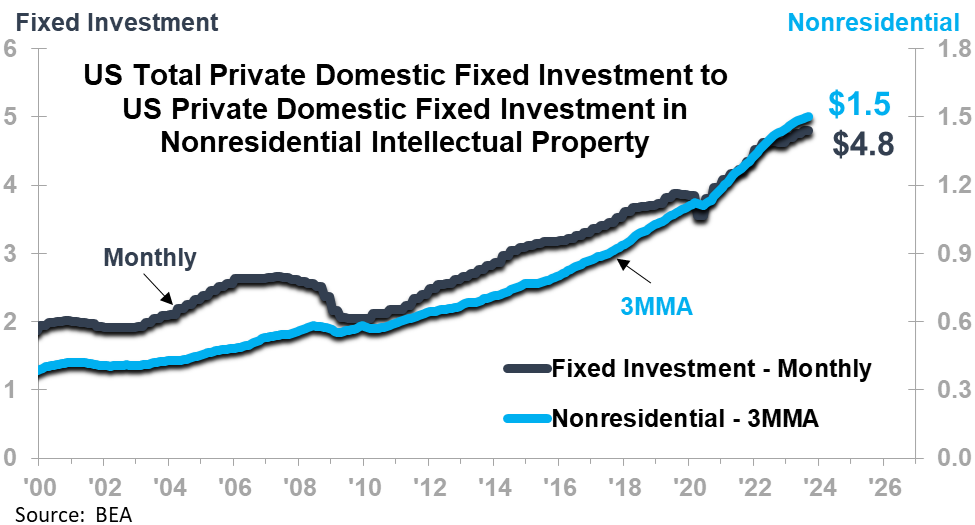
US Private Domestic Fixed Investment in Nonresidential Intellectual Property includes software, research & development, and entertainment, literary, and artistic originals. The 12MMA is at a record-high $1.476 trillion with a decelerating rate of rise ahead as indicated by the Phase C trends in the rates-of-change. The chart below shows that macroeconomic recessions do not have a significant impact on this area of private fixed investments. The projected mildness in the upcoming macroeconomic recession portends a flat to mildly positive trend in investment in Intellectual Property in the coming year.
Knowing how your company compares to the segments above will provide you with the ability to accurately plan your revenue, profits, and cash generation for the coming year. See our website at itreconomics.com for more information on how to compute your rate-of-change and compare it to external trends.
1 Total private domestic fixed investment in the US, measured in trillions of dollars, seasonally adjusted at annual rates (SAAR). Private fixed investment consists of purchases of residential and nonresidential structures, equipment and intellectual property products by private businesses in the US. Source: US Bureau of Economic Analysis.
2 Private nonresidential construction in the US, measured in billions of dollars, not seasonally adjusted (NSA). Includes private construction of the following types: office, commercial, automotive, lodging, dining, retail, warehouse, storage facilities, schools, dormitories, sports facilities, galleries, museums, hospitals, medical buildings, special care facilities, religious buildings, fitness centers, amusement parks, movie theaters, social centers, transportation facilities, power facilities, and manufacturing facilities. Source: US Census Bureau.