Solutions
2021 Commodity Price Outlook
My goal with this webinar is to share with you the connection between commodity prices and the overall economic outlook.
Learn how rising sales-to-inventory ratios in durable goods signal strong demand and positive economic momentum, impacting your business strategy for 2025.
As a business leader, think about your inventories for a moment. Which is better: when your inventories are growing faster than your sales, or when your sales are growing faster than your inventories?
It is not a trick question — of course the latter is better.
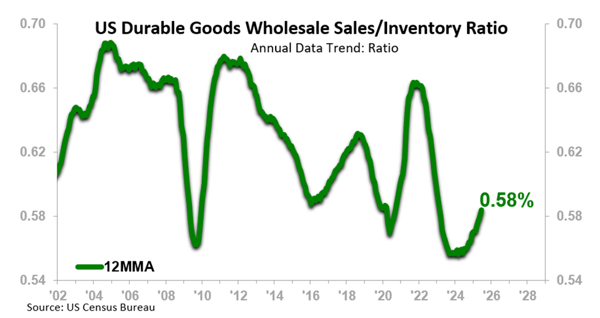
The same is true for the overall economy as well — rise in the US Durable Goods Wholesale Sales-to-Inventory Ratio is generally considered a good thing. In the chart below, the recent rise in the ratio looks like a ski jump:
More specifically, here is why rise in the Durable Goods Sales-to-Inventory Ratio bodes well for the overall US macroeconomy:
There are some caveats to the positive signals outlined above.
For some context behind the relatively low level of the ratio — from mid-2020 through much of 2021, the ratio spiked sharply, driven by both a surge in sales (pent-up demand) and depleting inventories (COVID-era supply chain disruptions). But from that peak, the ratio declined sharply through 2024, reflecting normalizing supply chains and cooling demand.
Going into greater depth for your specific markets will enable you to make investment decisions with confidence and help you avoid costly missteps as you navigate the tariff-impacted supply chain era. Contact us to learn how to use these indicators to their maximum potential to drive your business to the next level!
My goal with this webinar is to share with you the connection between commodity prices and the overall economic outlook.
The economic reality is that we need to recognize that we are living beyond our means as a country, and we need to take steps to address the problem.
In light of the stock market volatility of Monday, August 5, ITR Economics Consulting Principal Jackie Greene breaks down why the sky is NOT falling.