2030s Depression
Ask Us Your 2030s Great Depression Questions!
What are your most burning questions regarding the 2030s Great Depression? We want to hear from you!
$500 billion in charitable donations were made in 2022. What does the data suggest for contributions made in 2023, and what can we expect to see in 2024?
Americans are a giving people, with total contributions from all sources at $499.3 billion in 2022. Of that total, $319.040 billion come from individuals 1. Individual charitable contributions accounted for 63.9% of all charitable giving in 2022. The other sources were not even close.
| Source | Billions of $ | % of Total |
| Total | $499.330 | |
| Individuals | $319.040 | 63.9% |
| Foundations | $105.210 | 21.0% |
| Bequests | $45.600 | 9.2% |
| Corporations | $29.480 | 5.9% |
The generosity of individuals is key to religious organizations, colleges, humanitarian organizations, hospitals, medical research, and other causes that could not exist without this funding. These giving individuals touch millions of lives.
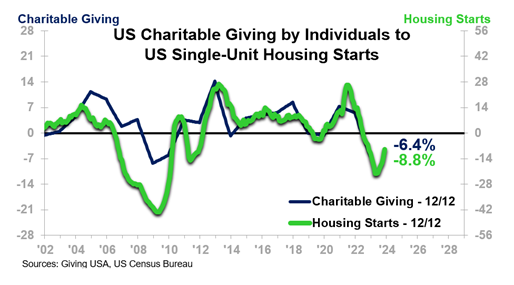
Charitable giving by individuals ended 2022 down $21.93 billion from the December 2021 record high, with a 12/12 of -6.4%. The 12/12 amplitude is the lowest in 13 years. The reason for the decline can be found in the escalating inflation, which began in 2021 and reached a peak in mid-2022, and the resulting inflation-fighting 400-basis-point hike in the federal funds rate from March 2022 to the end of that year. The impact of these two factors is easily seen in the housing market. The chart below shows that the 12/12 rate-of-change for Charitable Giving by Individuals (blue line) correlates well with the Housing Starts 12/12. The same pressures that resulted in the housing market decline also pushed the charitable giving 12/12 into Phase D.
The decline in charitable giving is real, but it is helpful to put it in context. 2022 giving slipped to $319.040 billion, but that is above the pre-COVID 10-year average of $256.565 billion and above the previous record high of $302.800 billion, set in 2018.
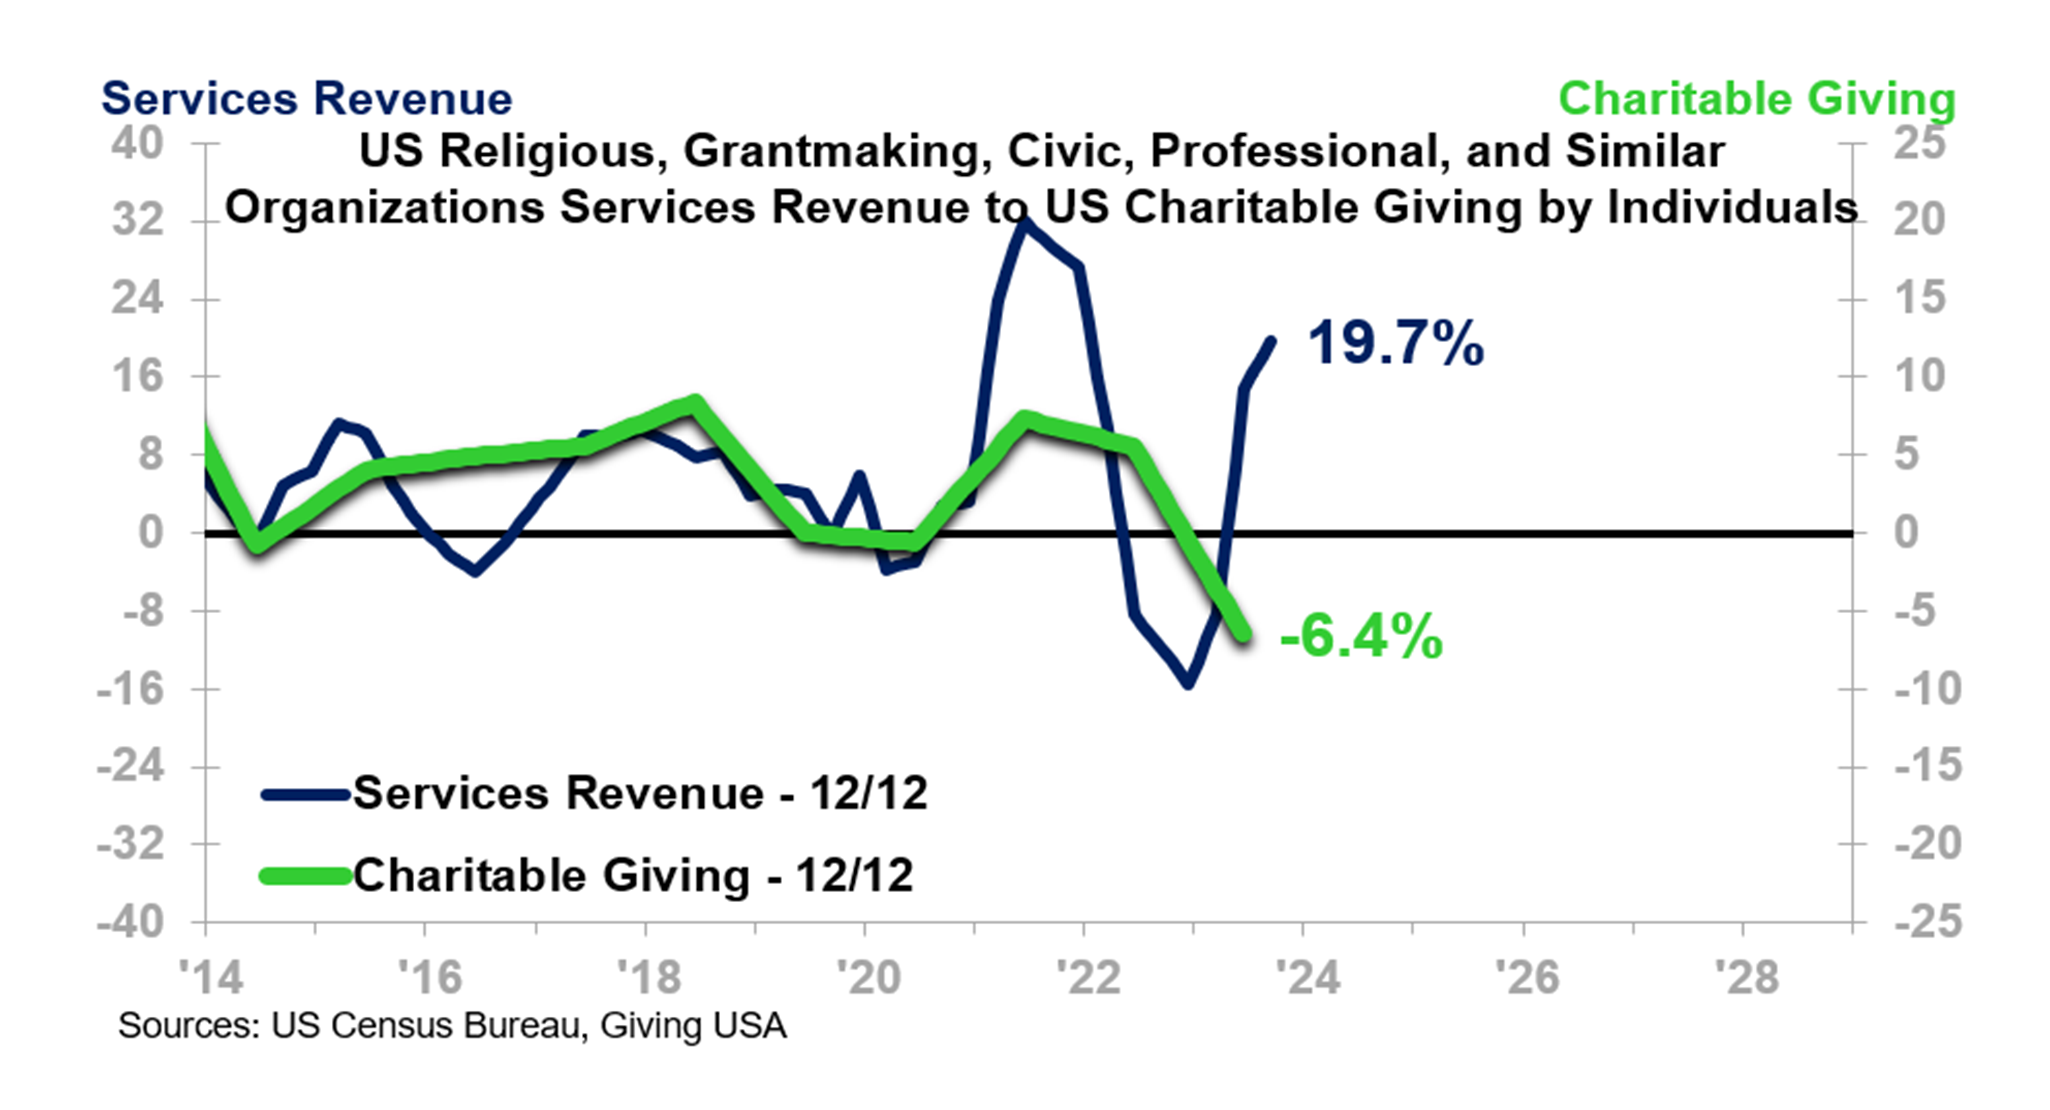
US Religious (and other) Services Revenue tracks well with GDP. This measure of Revenue in September 2023 reached a record-high $370.490 billion on the strength of the general economic expansion this year. This Revenue series does not account for all Charitable Giving by Individuals, which makes it a subset of the data examined above, but it has the advantage of being more current and therefore provides a useful benchmark for giving activity through 2023. The onset of rise in the Single-Family Housing Starts 12/12 is a positive sign for charitable giving in 2023. Charitable organizations in general are likely to have experienced an increase in receipts from individuals and other sources in 2023 in comparison to 2022.
The upside activity of 2023 may not carry far into 2024 given ITR Economics’ expectation of nagging consumer difficulties in the coming year. Our forecast is for GDP in 2024 to end the year slightly below the 2023 level, which by extension suggests that individuals will be experiencing a measure of constraint in their capacity to give to charity. Charities of all kinds would do well to budget for the coming year accordingly.
1 The data is annual. 2023 data will not be available until later in 2024.
What are your most burning questions regarding the 2030s Great Depression? We want to hear from you!
ITR Economics President Alan Beaulieu answers 5 more questions we received during the July 27, 2023, webinar about the 2030s Great Depression.
Two known downside risks for our GDP and US Total Industrial Production outlooks through 2025 relate to monetary policy.