Home Prices Are Declining
Home prices are down from record highs. A declining trend is evident for existing and new homes.
How did the housing market perform in 2019? It depends who you ask.
How did the housing market perform in 2019? It depends who you ask.
Many homeowners were delighted to see the value of their homes rise. Homebuilders, on the other hand, saw declining new construction this year. By region, the South is outperforming the rest of the US for new housing construction, while housing starts in the Midwest and West are below last year’s level.
Looking ahead, we expect total housing starts to rise throughout 2020 and into late 2021, driven mainly by growth in Single-Unit Housing Starts.
But, as they say, all real estate is local.
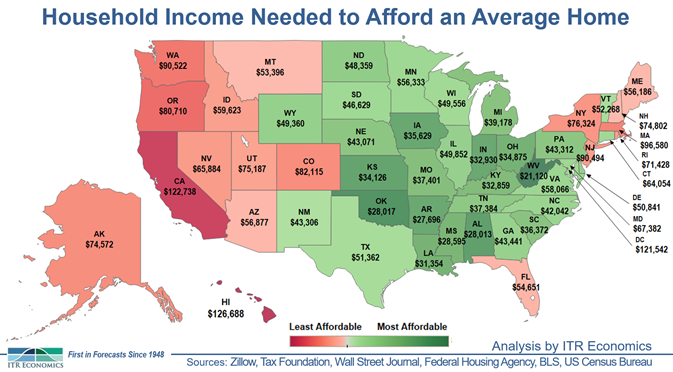
Affordability is a key driver of housing trends. The map shows the annual household income required to be able to afford the average home in each state and in Washington, DC. In Hawaii, the least affordable housing market, a household would need to earn $126,688 to afford the average home. By comparison, the necessary income is just $21,120 in West Virginia. The color coding on the map reveals how favorably each state's actual average income compares to the income needed to afford the average home.
Nationwide, the number of new homes sold in the past 12 months is at or below the year-ago level for most price brackets. The exception is homes in the $200,000–$299,000 range, which are up 13.9% from last year. This trend is driven by the southern region of the country, where new home sales were up 25.2% year over year. As shown on the map above, homes in this region tend to be relatively more affordable than in other regions, potentially attracting new residents and spurring demand for new homes in this price bracket. In the Northeast and in the West, in comparison, the highest growth rates for new home sales are in the market's higher-priced segments, while new home sales in the aforementioned $200,000–$299,000 bracket are declining.
So where does the housing market go from here? For many market participants, there are reasons for optimism. US Single-Unit Housing Starts will likely finish 2019 about 2% below the 2018 level but expand during 2020. If we can help you determine what these trends mean for you or your business, please reach out!
Lauren Saidel-Baker
Economist
Home prices are down from record highs. A declining trend is evident for existing and new homes.
Abundant natural gas is a primary contributor to the affordability of energy in the US.
Housing affordability remains a concern, but improvements in mortgage rates and earnings have helped ease affordability pressures for new homebuyers.