Objectivity is one of the key traits of a good doctor. Physicians tell patients what they need to know, not what they want to hear. Sometimes the patient needs to know a hard truth. Looking into 2019, the premier economic "doctor" currently has an unpleasant prognosis for the global economy.
Copper, or, more specifically, the price of copper, is the economic doctor of which I speak. A globally consumed commodity, copper is extremely diverse as far as its end uses. It is an input in a plethora of items across different sectors, including high-end electronic components and products, vehicles (electric or otherwise), wiring for homes and skyscrapers, industrial equipment, consumer products, and countless others. Due to its ubiquity, copper tends to be tied to the demand curves of virtually every global economy and industry. Its short-term predictive power regarding the global economy has earned it the moniker "Dr. Copper."
 As an economist, I lack the physician's bedside manner, so I'll just give it to you straight: The results are in, and they're not good. Copper Futures Prices closed October down 13.9% from their October 2017 level. Sustained year-over-year decline in Copper pricing tends to be a foreboding trend for Global Industrial Production growth.
Commodities are inherently volatile, particularly week to week and month to month, so as part of our ITR methodology, we like to smooth out monthly trends to be sure we are seeing a clear picture. A useful means for evaluating commodities is the three-month moving average (3MMA), which is simply the most recent three months of prices averaged together for a smoother data stream. Copper Prices during the most recent three months (August through October) averaged $2.70 per pound, down 11.1% (a 3/12 rate-of-change) from the same three-month period in 2017.
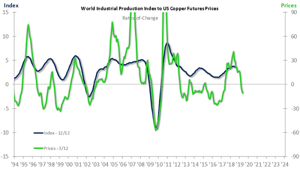
Charted above is the quarterly growth rate for Copper Futures Prices (green line) versus the annualized growth rate for World Industrial Production (blue line), published by the CEIC. Cyclical shifts in the Copper Futures Prices 3/12 typically lead those in the Production 12/12 by seven months.
Global Industrial Production’s growth rate peaked in April 2018 and has been decelerating since. The sharp decline in the Copper Prices 3/12 through October signals further downward movement in the growth rate of the global economy, into at least mid-2019. The pull-back in Copper Prices comes even as the United States – the world's largest single economy and one of the largest copper-consuming nations – is still accelerating. When the US economy moves to the other side of the business cycle and finally starts to slow, businesses will feel headwinds from all sides.
Business leaders should take control of what they can with this information. Those with a global client base are likely already seeing early signs of a slowdown in their orders from non-US customers. Understand that this is likely the start of a broader slowdown, not a one-off anomaly. Start preparing for the economic reality of next year – which unfortunately looks like slowing growth – by assessing cash needs in light of modified budget expectations and adjusting key stakeholders' assumptions regarding 2019 growth potential.
Doctor’s orders.
Connor Lokar
Economist