Colonial Pipeline Shutdown Exacerbates Rising Fuel Cost Trend
Rising Retail Sales are not a guarantee of a growing economy (because there are no guarantees in economics), but they come pretty darn close.
Rising Retail Sales are not a guarantee of a growing economy (because there are no guarantees in economics), but they come pretty darn close.
Rising Retail Sales are not a guarantee of a growing economy (because there are no guarantees in economics), but they come pretty darn close.
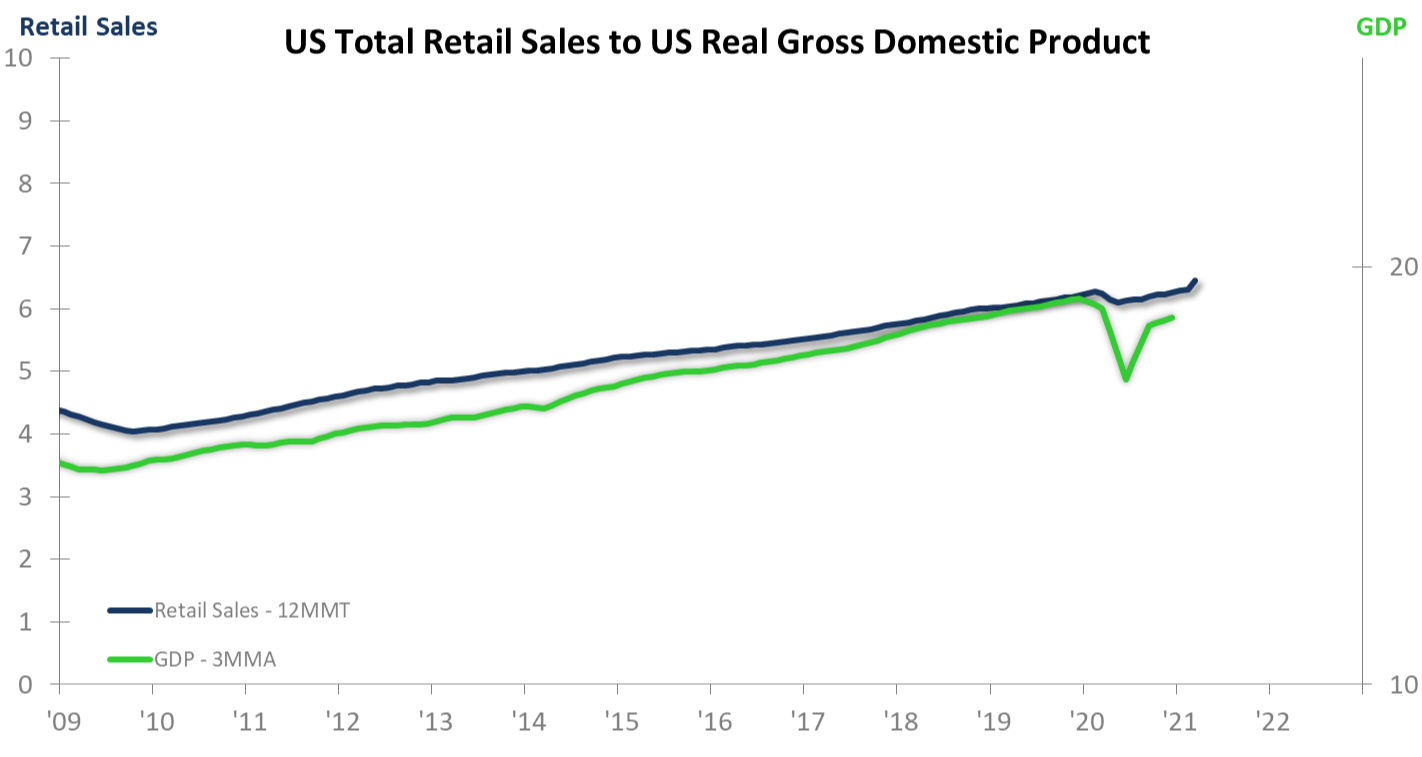
The chart below shows the annual moving total (12MMT) of Retail Sales. The Retail Sales trends tend to be coincident in timing with GDP, so the chart is really showing us the status quo. The upward trend in Retail Sales is a strong indicator of future rise in GDP if we can demonstrate that Retail Sales will continue to rise. We have external signals for that below. Before we go there, it is noteworthy that the 1Q21 seasonal decline in Retail Sales is the mildest in the post-WWII history. This is considered an internal signal. The seasonal trend means that the stimulus is distorting the normal behavior of Retail Sales in a positive manner, if you are pro general economic growth.
The next chart shows the relationship between the Retail Sales rate of growth (using the 12/12 rate-of-change) and the annual average data trend (12MMA) for Personal Savings as a Percentage of Disposable Personal Income.
Disposable Personal income is after-tax income; it has surged tremendously since the first stimulus checks were doled out in 2020. For the Savings Rate data trend to climb reflects not the increase in Disposable Personal Income, but how much of that income is being saved. Quite literally, people either have not been able or have not wanted to spend all the money the government continues to push into the economy.
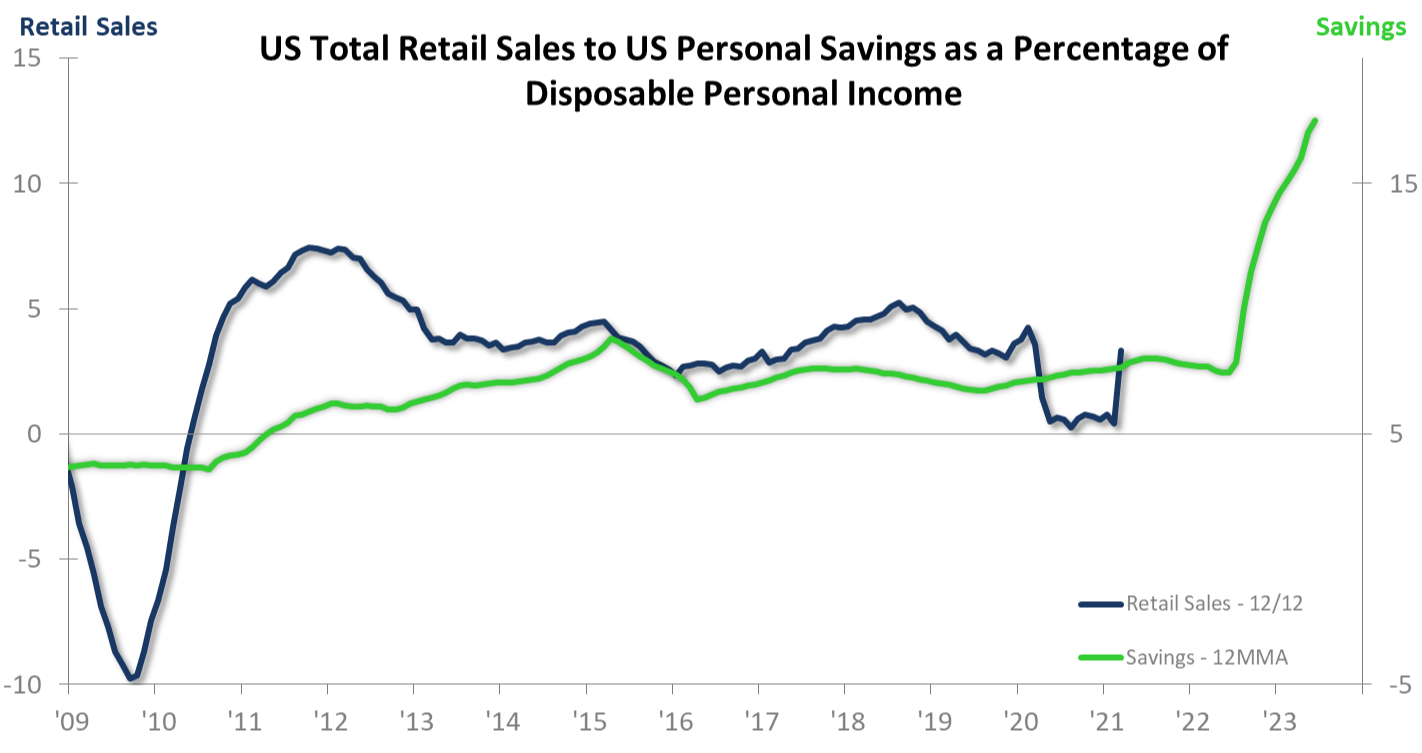
All those saved dollars represent to a large extent future Retail Sales. This chart is one of many reasons why we are upbeat about where Retail Sales are headed, and why GDP is going to keep rising!
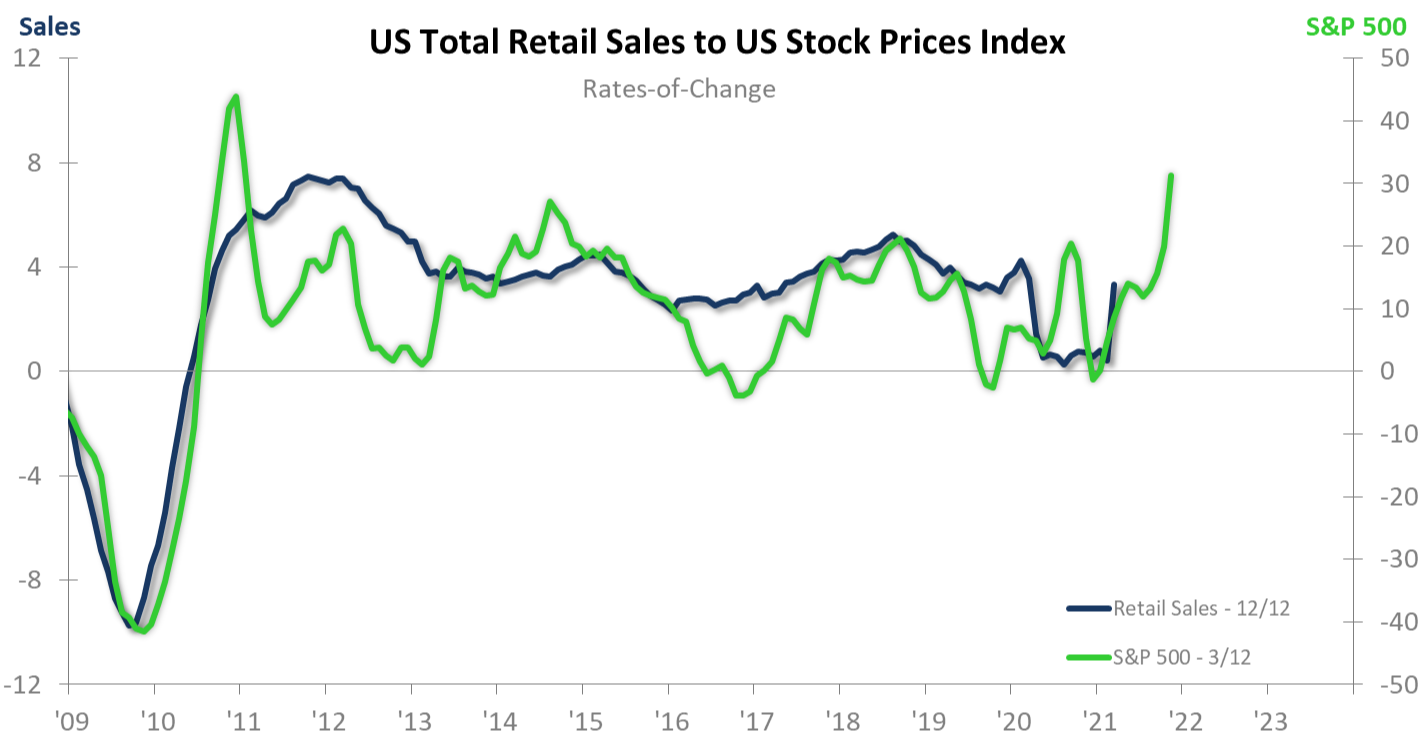
Need one more sign?
The third chart shows the relationship between the S&P 500 3/12 rate-of-change and the Retail Sales 12/12. The former leads the latter by eight months. The S&P 500 3/12 is soaring through March 2021. This tells us that we should expect a favorable Retail Sales trend into at least 4Q21.
The consumer drives the economy. The savings rate and S&P 500 show us where Retail Sales will trend. Plan for your business to experience rise if you are tied to GDP and/or more directly to the consumer.
Rising Retail Sales are not a guarantee of a growing economy (because there are no guarantees in economics), but they come pretty darn close.
Register today for the 2025 ITR Economics Summit as ITR Economist Taylor St. Germain presents supply chain trends and strategic insights!
Will the economy return to the old 'normal' or a 'new normal' altogether? See how ITR Economics can help you confidently plan for economic...